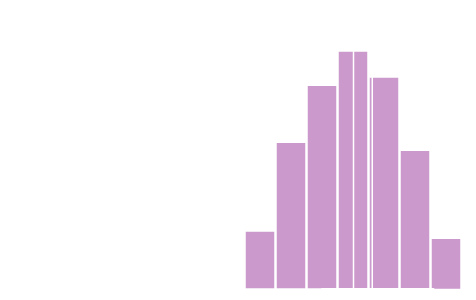
Normal | Process Capability
Binomial Poisson Normal Charts Histograms Hypothesis Testing
Central Limit Theorem Central Tendency Standard Deviation Process Capability RMSD Chi Error Types
The measure of the performance or capability of a model is the percentage of its rejects. We can measure this using Process Capability.

Process Capability can be measured as the ratio between the specified tolerance (T) and the process variation (±3σ), otherwise known as the Process Capability Index Cp
Cp = T/V = (USL - LSL)/6σ
Where;
Cp < 1 – Unsatisfactory
1 <= Cp <= 1.33 – Capable
Cp > 1.33 – Very good
It is possible for a Cp to be > 1, yet still have poor performance, if the X has shifted from the Tolerance middle (Tm).

We can account for this using a Process Capability correction Cpk
Cpk = Cp * (1 - k)
k = |Tm - X|/(T/2) where Tm = (USL + LSL) / 2
Above, everything withiin the pipes are considered absolute. Thus, if Tm - X is a negative value, you simply treat it as a positive value.
With Cpk availble; if Cp and Cpk are both > 1, then the performance is good.
If Cp > 1, but Cpk < 1, then the Process Capability is good, but the process setting is incorrect leading to poor performance.
If, however, both Cp and Cpk < 1, then the process has no potential and the performance will be bad.
Cpk can be negative if the average of the process output is shifted more than half the tolerance, or if the average is out of the tolerance.
Six Sigma Quality
If process variation can be reduced to half of the design tolerance (Cp = 2.0) then 12 σ’s should be able to fit within the original tolerance.
Cp = T/6σ therefore σ = T/12
If this is achievable, then we must check that the mean X is within ±1.5σ from tolerance middle Tm.
In some cases, controlling the process to stay centred on the target is less expensive than reducing the process variation.
The concept of 6 Sigma Quality is closely related to the process capability indices Cp and Cpk (see Chi).
The number of sigmas that will fit between the process mean and the nearest specification limit is likely to drop over time, compared to an initial short-term study. If the mean of the process drifts away from the centre of the tolerance, the distance between the mean and the nearest specification limit will be reduced and fewer standard deviations will fit between them.
Looking at the table below, if 6σ can be achieved with a shift in the mean of exactly 1.5, then the loss calculated at that rate will average 3.4 per million.
| off-centre sigma | Sigma Quality Level | ||||||
| 3 | 3.5 | 4 | 4.5 | 5 | 5.5 | 6 | |
| 0 | 2700 | 465 | 63 | 7 | 0.6 | 0.04 | 0.002 |
| 0.25 | 3557 | 665 | 99 | 12 | 1.1 | 0.08 | 0.005 |
| 0.5 | 6442 | 1382 | 236 | 32 | 3.4 | 0.29 | 0.02 |
| 0.75 | 12313 | 2990 | 578 | 88 | 11 | 1.0 | 0.1 |
| 1 | 22782 | 6213 | 1350 | 233 | 32 | 3.4 | 0.3 |
| 1.25 | 40070 | 12225 | 2980 | 577 | 88 | 11 | 0.1 |
| 1.5 | 66811 | 22750 | 6210 | 1350 | 233 | 32 | 3.4 |
| 1.75 | 105651 | 40059 | 12224 | 2980 | 577 | 88 | 11 |
| 2 | 158656 | 66807 | 22750 | 6210 | 1350 | 233 | 32 |
Calculator
| Tolerance | Plus | Minus | |||
| Standard Deviation | Mean | ||||
|
|
|||||