Normal | Central Limit Theorem
Binomial Poisson Normal Charts Histograms Hypothesis Testing
Central Limit Theorem Central Tendency Standard Deviation Process Capability RMSD Chi Error Types
Not to be confused with Central Tendency, is where the mean of the sample population will be approximately equal to the mean of the whole population.
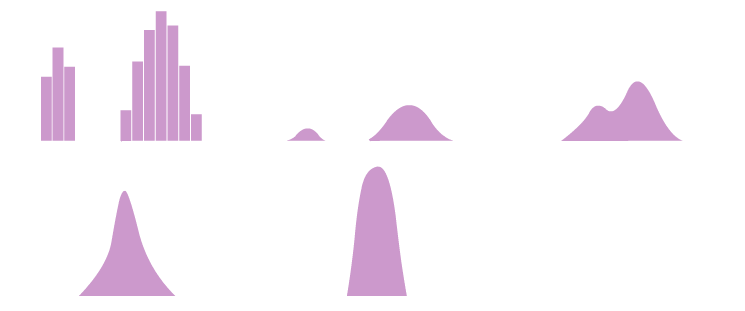
Central Limit Theorem is the notion that the distribution of a sample variable approximates a Normal Distribution as the sample size becomes larger, assuming that all samples are identical in size, of a finite variance, and regardless of the population’s actual distribution shape. Thus, the data may not start out as a normal distribution, but by repeatedly sampling, the “average of averages” results in a Normal Distribution.
The premise of CLT is:
- For almost all populations, the sampling distribution of the mean can be approximated closely by a normal distribution, provided the sample size is sufficiently large.
- If a variable has a mean of
µand a variance ofσ2, as the sizenincreases, the sample mean approaches a normal distribution withµx and varianceσ(2⁄x).
Therefore;
- The “average of averages” is simply that
µx = µ. - The variance of the sample mean’s will be the variance of the population divided by the total sample size
σ2x =σ2x⁄n. Or, put another way,σx = σx⁄√n. Thus, "the stardard deviation of sample averages / means" is equal to "the standard deviation of the population" devided by "the square-root ofn".
Simple Explanation
Central Limit Theorem calculates the mean or average of the population or sample.