Charts | Basics of Control Charts
Binomial Poisson Normal Charts Histograms Hypothesis Testing
p Chart pn Chart u Chart c Chart X-Bar R X-Bar s I-MR / X-MR Out-of-Control
There are several chart types you can use when plotting your data, with each chart pertaining to specific types of data.
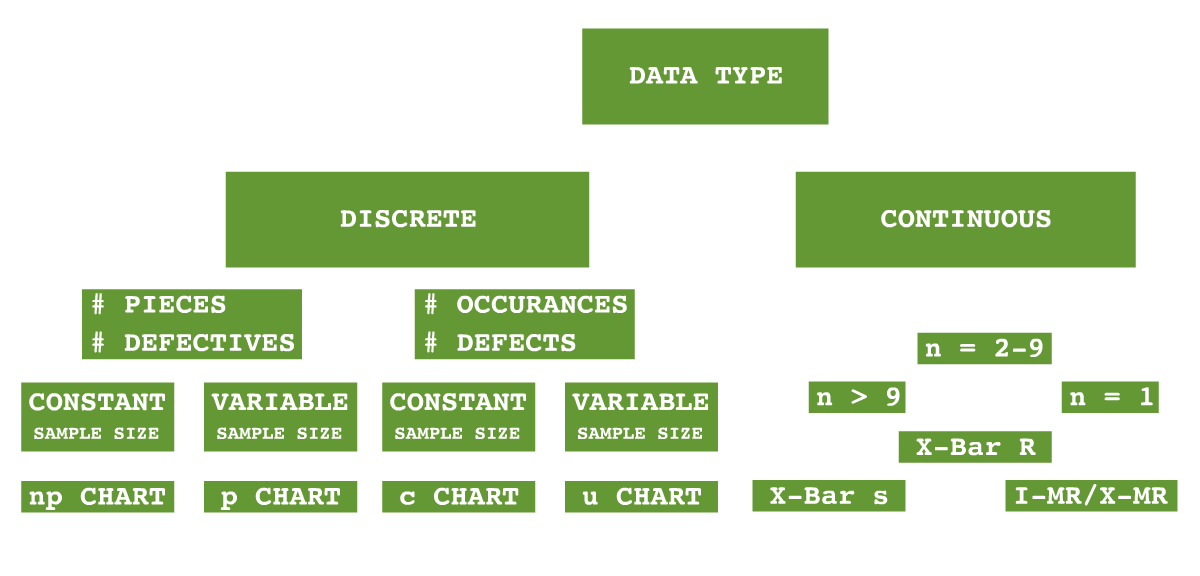
If your data represents absolute integer values, such as the count of a given attribute, then your data should be represented by a Discrete chart. Alternatively, if your data represents a variable floating point value, such as a measurement, then a Continuous chart should be used.
Variable data includes attributes such as the percentage of humidity (eg. 82.63%) or the length, width or height of a given product.
This section covers the different charts, relevant calculations & formulas and a discussion of the types of data pertaining to them.
Choosing a Chart
| Data Type | Distribution | Subgroup Size | Control Chart |
|---|---|---|---|
| Variable | Any | 1 | Individuals & Moving R |
| 2-10 | X-Bar R Chart | ||
| More than 10 | X-Bar S Chart | ||
| Attribute | Binomial | Constant | np Chart |
| Varying | p Chart | ||
| Poisson | Constant | c Chart | |
| Varying | u Chart |