Normal | Central Tendency
Binomial Poisson Normal Charts Histograms Hypothesis Testing
Central Limit Theorem Central Tendency Standard Deviation Process Capability RMSD Chi Error Types
Not to be confused with Central Limit Theorem, is where the center or the middle location of the distribution is the average value of a probability distribution.
When given a collection of values, the Central Tendency is the tendency for values to settle in the middle of the value range. This observation is typical with data that may deviate from a given value by order of probability, meaning that the central tendency should be the desired value while those falling above or below are “deviated” from that desired value.
Note that the central tendency may not always be the desired value. For instance, in machining a product, the calibration of the machines may be off, meaning that the most common outcome is some way off the desired outcome, forcing the central tendency to be higher (or lower) than what is desired.
Finding a Central Tendency requires simple math; particularly “mean”, “median” or “mode” calculations.
Simple Explanation
Central Tendency gives the central value of the population or sample.
Calculator
| Calculation | |||||
|
|
|||||
Mean or Average
Symbols
x (x-bar) means "average"σ is "sigma" and means "standard deviation"Σ is also called "sigma" (confusing) and means "sum"x = Σ x⁄n where n is number of valuesMedian
Place values in ascending or descending order and take the middle value. If two middle numbers (even total), then add two nums together and divide by two.
90, 98, 104, 104, 104
85, 90, 98, 104, 104, 104 = (98 + 104)⁄2 = 101
Mode
The number occurring the most number of times.
85, 104, 90, 98, 104, 104
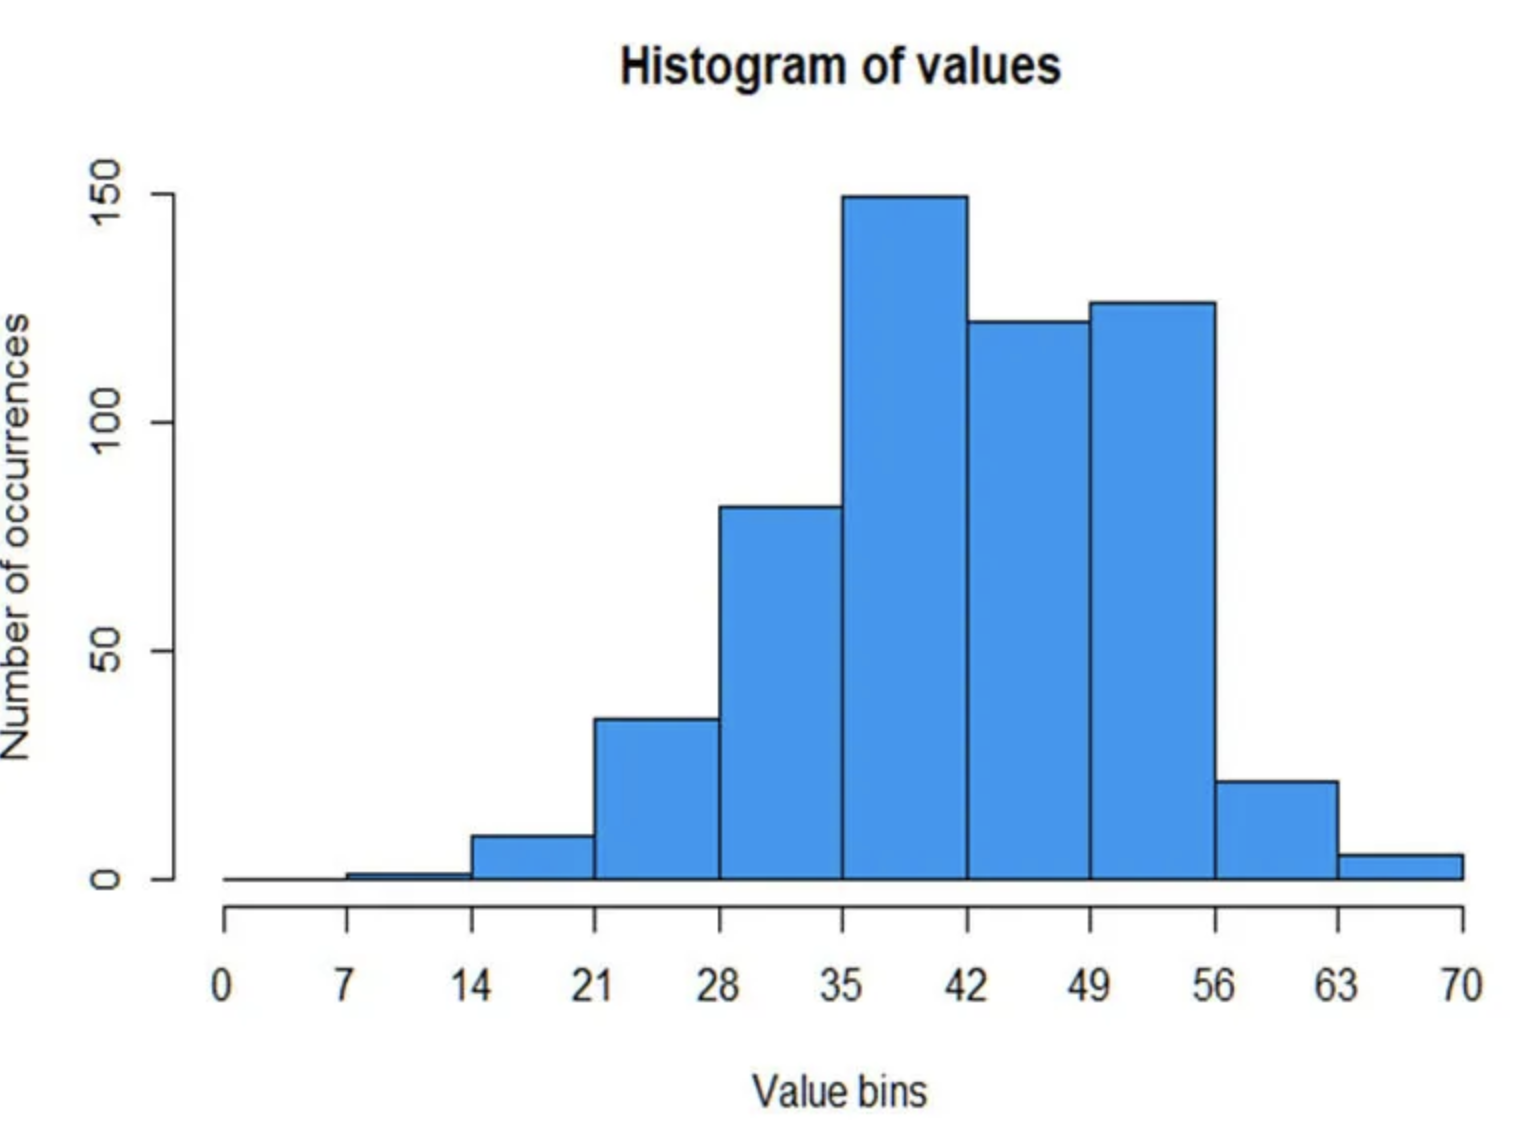
Mode in Histogram
In the below histogram, we can see that the highest peak is the mode, since
it represents the most common value.
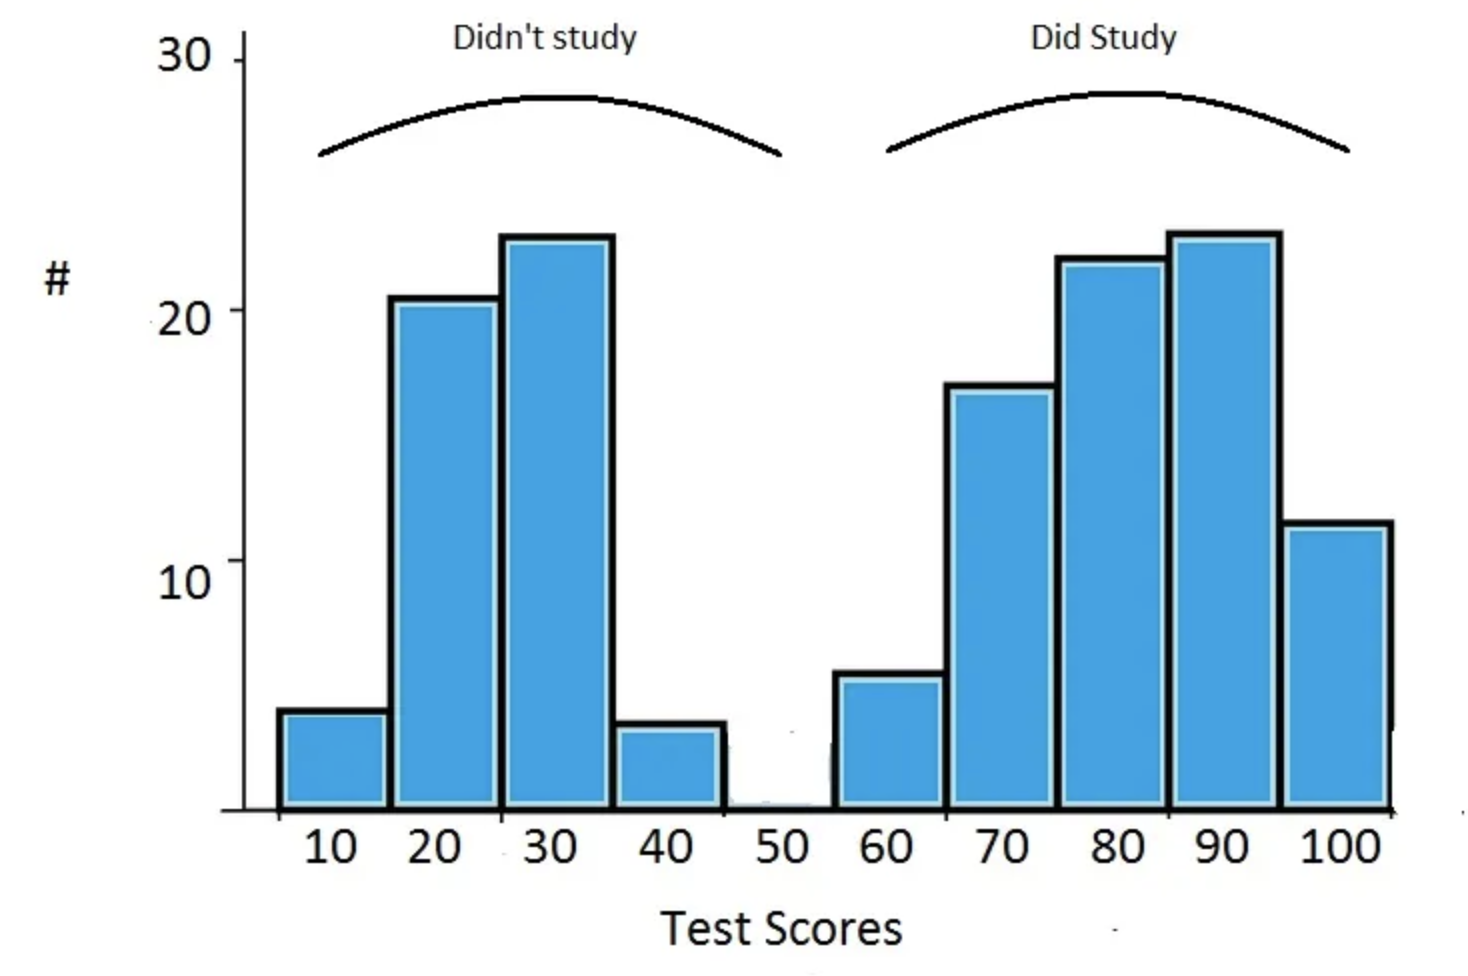
In a bi-modal histogram, we would say there are “two modes”. Hence
why it’s called bi-modal (two-modes).