Normal | Error Types
Binomial Poisson Normal Charts Histograms Hypothesis Testing
Central Limit Theorem Central Tendency Standard Deviation Process Capability RMSD Chi Error Types
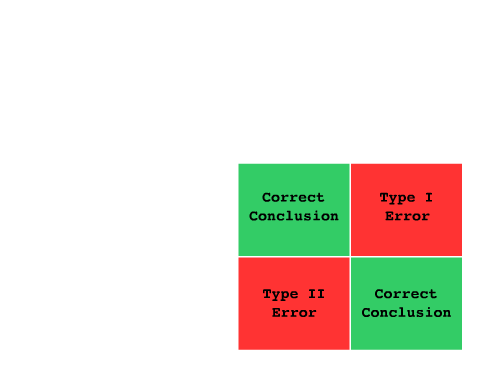
Errors can occur for one of two reasons. As shown in the image below, if a control chart suggests that an adjustment to the process should occur and a change in the process did indeed occur during the duration of the chart, then the conclusion is correct. Likewise, if no changes are made following the result of a control chart and no change in process has occurred for the duration, then the conclusion is also correct.
Now, if there are special causes in a control chart and the reader decides to make an adjustment to the process, but no changes to the process occurred during the duration of the chart, then this is a Type I error. It is not the correct course of action to amend a process due to special causes. Adjusting a process needlessly can result in the increased rejection of good components.
Additionally, if the reader of the chart chooses to make no adjustments to the process, but the process has indeed changed during the duration of the chart, then this is a Type II error.
Simple Explanation
Type I Error: A fire alarm keeps sounding when there are no fires leading to inconvenience. The effects are an increase in cost due to frequent changes. In ths context of a control chart, we have unnecessary adjusting of in-control process.
Type II Error: A fire occurred but the alarm did not sound. The effects, here, are that defects may be produced. In the context of a control chart, we are not recognizing that the process has changed.